Reflecting on the Nation’s Work-Related Ill Health Statistics for 2023/24
Back in November, the HSE published it’s annual health & safety at work statistics for the 2023/2024 period. In this article, we look into the statistics for work-related ill health.
What has changed in a year?
- 1.7 million (
5.6% decrease) individual workers suffering from work-related ill health (new or long-standing).
- 609,000 (
6.4% decrease) workers suffering from a new case of work-related ill health in 2023/24.
- 29.6 million (
6% decrease) working days lost.


The deep-dive
- The 6% decline seen in working days lost would appear to be in a positive correlation with the 6.4% decrease in new cases of work-related ill health. However, to analyse the long term trends, the HSE focuses on the rate of self-reported work-related ill health per 100,000 workers, which accounts for ‘variations in the number of people in work between years’, not just the amount of individual workers. According to the HSE, ‘The current rate (4,940 per 100,000 workers) is higher than the 2018/19 pre-coronavirus level.’
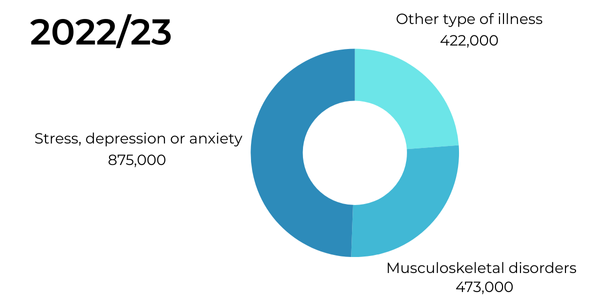
- Even though musculoskeletal disorders seem to have increased, it is the rate per 100,000 workers that again tells the overall story for long term trends. At the current rate, it is similar to pre-pandemic levels which were generally showing a downward trend.
- To no surprise, disorders affecting the back made up a large percentage of the most common type of musculoskeletal disorder, followed closely by disorders affecting the upper limbs or neck.
- A similar story reoccurs with self reported individual accounts of stress, depression, and anxiety decreasing compared to the previous year, however the rate per 100,000 workers is still higher than pre-pandemic level.
What industries are most affected by stress, depression, and anxiety?
It is also interesting to note that there are certain industries where the rate of work-related stress, depression or anxiety are higher than average.
The higher-than-average-rate can be seen within the following occupational groups:
- Health professionals
- Teaching and other educational professionals
- Business, media and public service professionals
- Health and social care associate professionals
- Protective service occupations.
Many of the above occupations are within the public sector meaning they are associated with high levels of public engagement.
The main causes of stress, depression, and anxiety within these groups were attributed to workload pressures (including tight deadlines and too much responsibility) and a lack of managerial support. Other factors identified included violence and bullying, organisational changes at work and role uncertainty (lack of clarity about job/uncertainty about what they are meant to do).
The importance of promoting awareness of occupational health in 2025
Overall, whilst there has been no majorly significant change from the preceding year, it is important to continue to stress the importance of occupational health interventions going forward in 2025 and beyond, as well as raise awareness of occupational health issues so that both employers and employees can make positive changes to work environments and habits so as to reduce risks and aid preventative measures in reducing workplace ill health.
